Prometheus 是云原生监控领域的事实标准,2012 年由 SoundCloud 发起,2016 年成为 CNCF 第二个毕业项目(仅次于 Kubernetes)。本文从架构、安装、服务发现、K8s 监控、PromQL 等十个维度,系统性地剖析 Prometheus 的设计原理与实战技巧。
1. Prometheus 架构
整体架构
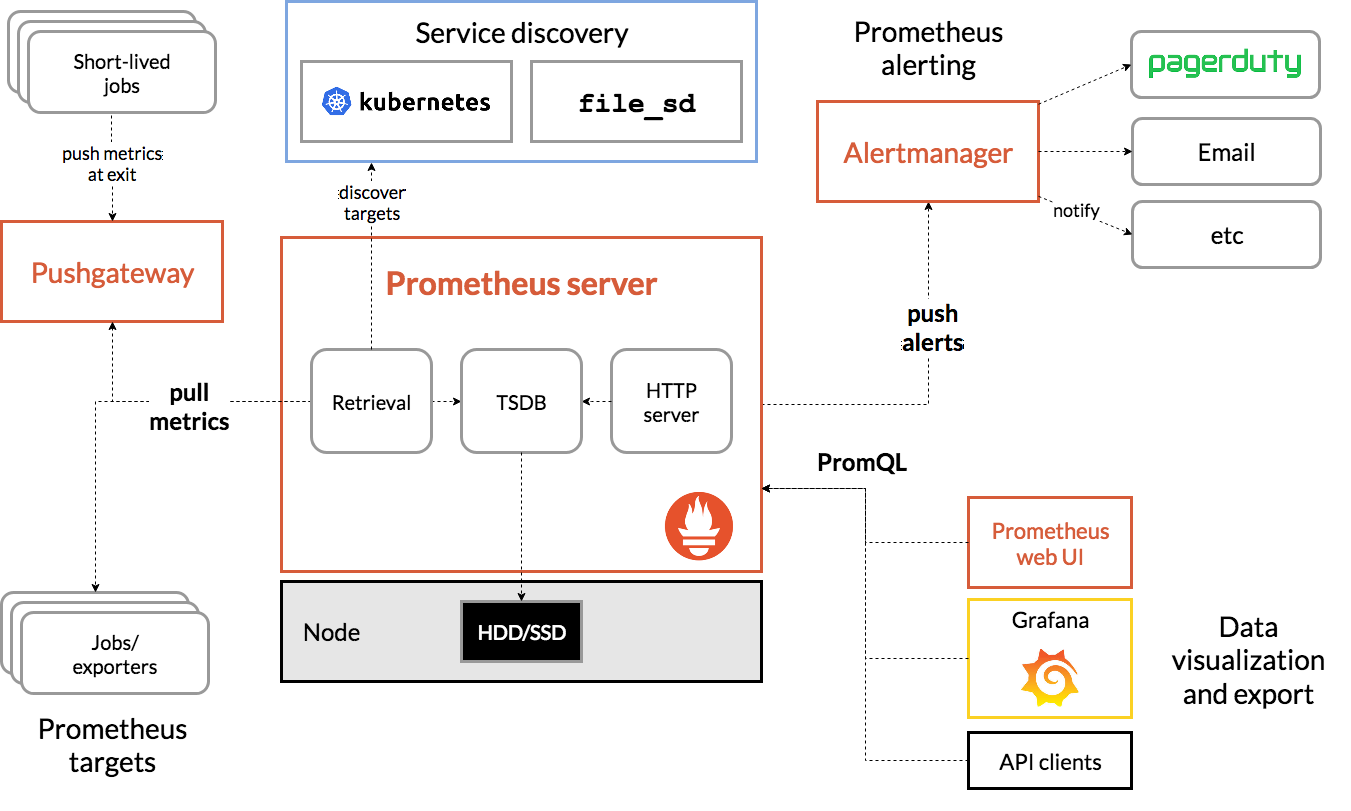
Prometheus 生态由以下核心组件构成:
- Prometheus Server:生态中枢,负责指标采集(Retrieval)、时序存储(TSDB)、查询服务(HTTP Server)
- Exporters:将第三方系统的指标转换为 Prometheus 可识别格式(如 Node Exporter、MySQL Exporter)
- Pushgateway:为短生命周期任务提供推送式指标中转站
- Alertmanager:接收 Prometheus 告警,进行去重、分组、路由、抑制后通知
- Service Discovery:动态发现监控目标(Kubernetes、Consul、DNS 等)
- Grafana / 表达式浏览器:数据可视化
数据流全链路(官方架构图):

textTargets (应用/Exporter)
    ↓ HTTP GET /metrics (Pull)
Prometheus Server
    ├── Retrieval (采集引擎)
    │     ├── Service Discovery (发现 Target)
    │     └── Scrape Manager (调度采集)
    ├── TSDB (时序数据库)
    │     ├── Head Block (内存写入)
    │     ├── WAL (预写日志)
    │     ├── Persistent Blocks (持久化块)
    │     └── Compaction (压缩合并)
    ├── Rules Engine (规则引擎)
    │     ├── Recording Rules (预计算)
    │     └── Alerting Rules (告警评估)
    └── HTTP Server (API/UI)
          ├── PromQL 查询
          └── Remote Read/Write
    ↓ 告警
Alertmanager (去重/分组/路由/通知)
    ↓ 可视化
Grafana
Prometheus Server 内部交互
Prometheus Server 启动后,各子系统的协作流程:
- 配置加载:
config/包解析prometheus.yml,构建 scrape 配置和 SD 配置 - 服务发现:
discovery/包根据配置启动对应的 Discoverer(如 Kubernetes SD),持续 watch 目标变化,将结果写入 channel - 采集调度:
scrape/包的 ScrapeManager 从 SD channel 读取目标列表,为每个 job 创建 ScrapePool,按scrape_interval周期性发起 HTTP 请求 - 数据写入:采集到的样本通过 Appender 接口写入 TSDB 的 Head Block,同时写入 WAL 保证持久性
- 规则评估:
rules/包的 Manager 按evaluation_interval周期评估 recording rules 和 alerting rules - 查询服务:
web/包提供 HTTP API,promql/包的 Engine 解析和执行 PromQL 查询
源码架构
Prometheus 源码仓库 (prometheus/prometheus) 的核心目录:
textprometheus/
├── cmd/prometheus/     # 主入口 main.go
├── config/             # 配置文件解析 (prometheus.yml)
├── discovery/          # 服务发现实现
│   ├── kubernetes/     # K8s 服务发现
│   ├── consul/         # Consul 服务发现
│   ├── dns/            # DNS 服务发现
│   ├── file/           # 文件服务发现
│   ├── http/           # HTTP 服务发现
│   └── ...             # 其他 SD (EC2, GCE, Azure 等)
├── scrape/             # 采集引擎 (ScrapeManager, ScrapePool, Scraper)
├── tsdb/               # 时序数据库
│   ├── head.go         # Head Block (内存)
│   ├── wal/            # 预写日志
│   ├── index/          # 倒排索引
│   ├── chunks/         # 数据块存储
│   ├── tombstones/     # 删除标记
│   └── compact.go      # 压缩合并
├── promql/             # PromQL 解析与执行引擎
│   ├── parser/         # 语法解析
│   ├── engine.go       # 查询执行
│   └── math.go         # 数学函数
├── rules/              # 规则引擎 (Recording/Alerting)
├── web/                # HTTP API 和 UI
├── storage/            # 存储抽象层 (本地 + Remote)
├── notifier/           # 告警通知发送
├── promhttp/           # HTTP 中间件 (instrumentation)
└── model/              # 数据模型 (labels, value, time)
TSDB 内部结构详解
Prometheus 本地存储(TSDB)是理解 Prometheus 性能特性的关键:
Head Block(内存块):
- 所有新写入的样本首先进入 Head Block
- Head Block 中的 series 通过内存中的 hash map 快速定位
- 每个时间序列在内存中维护一个 chunk 切片,chunk 使用 XOR 编码压缩浮点数
- 默认每个 chunk 容纳 120 个样本,满后刷入磁盘
WAL(Write-Ahead Log):
- 每个样本写入 Head Block 前先写入 WAL
- WAL 按段(segment)组织,默认每段 128MB
- 崩溃恢复时从 WAL 重放,保证数据不丢失
- 可通过
--storage.tsdb.wal-compression启用 WAL 压缩
Persistent Block(持久化块):
- Head Block 写满一个时间窗口后(默认 2 小时),刷入磁盘成为一个 Persistent Block
- 每个 Block 目录结构:
text<block_id>/
├── chunks/        # 压缩后的样本数据
├── index/         # 倒排索引 (series → chunks 映射)
├── meta.json      # 元信息 (时间范围、compaction level)
└── tombstones # 删除标记Compaction(压缩合并):
- 将多个较小的 Block 合并为较大的 Block,减少 Block 数量
- 合并同时重建索引,提升查询效率
- Compaction level:L0(2h) → L1(6h) → L2(18h) → L3(54h)...
- 通过
--storage.tsdb.retention.time控制数据保留时长(默认 15 天)
查询路径:
- PromQL 查询时,Engine 同时查询 Head Block(内存)和 Persistent Blocks(磁盘)
- 通过倒排索引快速过滤匹配 label 的 series
- 数据从 chunks 文件读取后解码返回
2. 拉取与推送模型
Pull 模型:核心设计
Prometheus 采用 Pull 模型采集指标,即 Prometheus 主动向目标发起 HTTP GET 请求获取 /metrics 端点的数据。
Pull 模型的优势:
- 服务自省:Prometheus 知道哪些目标健康、哪些不可达(up 指标)
- 简化客户端:被监控服务只需暴露 HTTP 端点,无需知道 Prometheus 的存在
- 避免推送风暴:不会因大量客户端同时推送导致服务端过载
- 调试方便:直接浏览器访问 /metrics 即可查看指标
核心配置参数:
| 参数 | 默认值 | 说明 |
|---|---|---|
scrape_interval | 1m | 采集间隔 |
scrape_timeout | 10s | 单次采集超时 |
metrics_path | /metrics | 指标端点路径 |
honor_labels | false | 是否保留抓取数据中已有的 job/instance 标签 |
honor_timestamps | true | 是否使用目标暴露的时间戳 |
scheme | http | 协议 (http/https) |
honor_labels 详解:
当 Prometheus 抓取数据时,会自动附加 job 和 instance 标签。如果目标暴露的指标本身也有这些标签,就产生冲突:
honor_labels: false(默认):Prometheus 保留自己的标签,将目标的冲突标签重命名为exported_job、exported_instancehonor_labels: true:保留目标暴露的标签,忽略 Prometheus 附加的标签
典型场景:抓取 Pushgateway 或联邦化时,需要设为 true。
Scrape 生命周期
一次完整的采集过程:
text1. Service Discovery 产生目标列表
     ↓
2. relabel_configs (抓取前重标签)
   - 过滤不需要的目标
   - 修改 __address__、__metrics_path__ 等元标签
   - 添加自定义标签
     ↓
3. 构造 HTTP 请求
   - GET http://<__address__><__metrics_path__>
   - 添加 Accept 头协商协议
   - 添加认证头 (basic_auth / bearer_token)
     ↓
4. 发送请求,等待响应 (scrape_timeout)
   - 成功:解析 exposition format
   - 超时/错误:记录 up=0
     ↓
5. 解析响应体
   - 支持 Prometheus text format 和 OpenMetrics format
   - 解析指标名称、标签、值、时间戳
     ↓
6. metric_relabel_configs (抓取后重标签)
   - 过滤不需要的指标
   - 修改指标标签
     ↓
7. 追加到 TSDB (Appender)
   - 写入 Head Block + WAL
   - 更新 up 指标 (1=成功, 0=失败)
每次采集后,Prometheus 会自动生成 up 指标:
up{job="xxx", instance="yyy"} = 1:采集成功up{job="xxx", instance="yyy"} = 0:采集失败
这是 Pull 模型的核心优势之一——通过 up 指标可以精确知道目标是否可达。
Push 模型:Pushgateway
Pushgateway 是 Prometheus 生态中唯一的推送入口,用于短生命周期任务(如 Cron Job、批处理脚本)推送指标。
为什么需要 Pushgateway:
Pull 模型无法监控短生命周期进程——这些进程可能只运行几秒就退出,Prometheus 的采集间隔(通常 1 分钟)可能永远抓不到它。Pushgateway 充当中转站,进程退出前把指标推送给 Pushgateway,Prometheus 再从 Pushgateway 拉取。
API 接口:
bash# 推送指标(覆盖同名 job+labels 组合)
curl -X POST http://pushgateway:9091/metrics/job/my_job/instance/my_instance \
  -d 'my_metric 42'

# 推送指标(合并,不覆盖其他指标)
curl -X PUT http://pushgateway:9091/metrics/job/my_job/instance/my_instance \
  -d 'my_metric 42'

# 删除某 job+instance 的所有指标
curl -X DELETE http://pushgateway:9091/metrics/job/my_job/instance/my_instance

# 删除所有指标
curl -X DELETE http://pushgateway:9091/api/v1/metrics
Python 推送示例:
pythonfrom prometheus_client import CollectorRegistry, Gauge, push_to_gateway

registry = CollectorRegistry()
g = Gauge('batch_job_duration_seconds', 'Duration of batch job', registry=registry)
g.set(123.4)

# 推送到 Pushgateway
push_to_gateway('pushgateway:9091', job='batch_process', registry=registry)
Go 推送示例:
gopackage main

import (
    "log"
    "time"

    "github.com/prometheus/client_golang/prometheus"
    "github.com/prometheus/client_golang/prometheus/push"
)

func main() {
    startTime := time.Now()
    // ... 执行批处理任务 ...

    duration := prometheus.NewGauge(prometheus.GaugeOpts{
        Name: "batch_job_duration_seconds",
        Help: "Duration of batch job",
    })
    duration.Set(time.Since(startTime).Seconds())

    if err := push.New("http://pushgateway:9091", "batch_job").
        Collector(duration).
        Push(); err != nil {
        log.Fatal(err)
    }
}
Pushgateway 的局限性:
- 单点问题:所有推送都经过 Pushgateway,它成为瓶颈和单点故障
- 数据不是实时的:即使推送的进程已退出,Pushgateway 仍保留数据,Prometheus 会持续拉到"过期"数据
- 不适合服务监控:不要把 Pushgateway 当作服务代理,长期运行的服务应该暴露 /metrics 端点让 Prometheus 直接拉取
- up 指标失真:Prometheus 抓取 Pushgateway 成功时 up=1,但无法反映推送源是否还活着
Pushgateway 的 prometheus.yml 配置:
yamlscrape_configs:
  - job_name: 'pushgateway'
    honor_labels: true    # 必须设为 true,保留推送时指定的 job/instance
    static_configs:
      - targets: ['pushgateway:9091']
Remote Write API
Prometheus 支持将采集到的数据远程写入外部存储,实现长期保存:
yamlremote_write:
  - url: "http://thanos-receive:19291/api/v1/receive"
    queue_config:
      max_samples_per_send: 10000
      capacity: 20000
      max_shards: 100
    write_relabel_configs:
      - source_labels: [__name__]
        regex: 'go_.*'
action: drop # 不发送 Go runtime 指标常见远程存储方案:
| 方案 | 特点 |
|---|---|
| Thanos | 支持长期存储(S3/GCS)、全局查询、高可用 |
| Cortex | 多租户、支持 Cassandra/S3 后端 |
| VictoriaMetrics | 高性能、兼容 Prometheus 协议 |
| Mimir | Grafana Labs 出品,Cortex 分支 |
| Loki | 日志系统,不存储指标但常配合使用 |
Pull vs Push 对比
| 维度 | Pull | Push |
|---|---|---|
| 谁发起 | Prometheus 主动拉取 | 目标主动推送 |
| 健康感知 | 通过 up 指标自动感知目标状态 | 无法自动感知推送源状态 |
| 配置复杂度 | 需要配置目标地址 | 目标自注册 |
| 流量控制 | Prometheus 控制采集频率 | 可能出现推送风暴 |
| 适用场景 | 长期运行的服务 | 短生命周期任务 |
| 调试 | 浏览器直接访问 /metrics | 需要 Pushgateway 中转 |
| 防火墙友好 | 需要 Prometheus 能访问目标 | 需要目标能访问 Pushgateway |
3. 监控指标方法论
Google 四个黄金信号 (Four Golden Signals)
出自 Google SRE Book 第 6 章,是面向用户请求驱动型服务的监控方法论。
1. 延迟 (Latency)
定义:服务处理一个请求所花费的时间。需要区分成功请求和失败请求的延迟——一个返回 500 错误的请求可能延迟极低(因为快速失败了),如果只看平均值会掩盖问题。
Prometheus 指标示例:
promql# HTTP 请求延迟直方图
http_request_duration_seconds_bucket{handler="/api/users", le="0.1"}
http_request_duration_seconds_sum
http_request_duration_seconds_count

# P99 延迟
histogram_quantile(0.99, rate(http_request_duration_seconds_bucket[5m]))

# 区分成功/失败请求的 P99
histogram_quantile(0.99,
  sum by (le, status_code) (
    rate(http_request_duration_seconds_bucket{status_code=~"2.."}[5m])
  )
)
2. 流量 (Traffic)
定义:衡量系统承载的请求量。不同系统有不同的流量衡量方式:HTTP 服务用 QPS,数据库用 TPS,流媒体用带宽。
Prometheus 指标示例:
promql# 每秒请求量 (QPS)
rate(http_requests_total[5m])

# 按状态码分类的 QPS
sum by (status_code) (rate(http_requests_total[5m]))

# 入站流量 (bytes)
rate(http_request_size_bytes_sum[5m])
3. 错误 (Errors)
定义:请求失败的比率。包括显式错误(HTTP 500)和隐式错误(返回了错误内容、响应超时等)。
Prometheus 指标示例:
promql# 错误率
sum(rate(http_requests_total{status_code=~"5.."}[5m]))
/
sum(rate(http_requests_total[5m]))

# 错误率超过 1% 告警
100 *
sum(rate(http_requests_total{status_code=~"5.."}[5m]))
/
sum(rate(http_requests_total[5m])) > 1
4. 饱和度 (Saturation)
定义:系统资源的使用程度,反映系统有多"满"。关注的是最受限的资源——当某个资源达到上限时,系统性能会急剧下降。
Prometheus 指标示例:
promql# CPU 饱和度 (运行队列长度)
node_load1 / on(instance) count(node_cpu_seconds_total{mode="idle"}) by (instance)

# 内存饱和度
1 - node_memory_MemAvailable_bytes / node_memory_MemTotal_bytes

# 磁盘饱和度 (IO 等待)
rate(node_cpu_seconds_total{mode="iowait"}[5m])

# 连接池饱和度
mysql_connections_active / mysql_connections_max
Netflix USE 方法
由 Brendan Gregg(Netflix 性能工程团队)提出,适用于基础设施资源(CPU、内存、磁盘、网络)的监控方法论。
USE = Utilization + Saturation + Errors
- Utilization(利用率):资源忙碌的百分比
- Saturation(饱和度):资源排队/溢出的程度
- Errors(错误):错误事件计数
CPU 资源:
| 指标 | 类型 | Prometheus 指标 |
|---|---|---|
| 利用率 | Utilization | 1 - rate(node_cpu_seconds_total{mode="idle"}[5m]) |
| 饱和度 | Saturation | node_load1 / count(node_cpu_seconds_total{mode="idle"}) by (instance) |
| 错误 | Errors | rate(node_cpu_seconds_total{mode="steal"}[5m])(虚拟化 CPU 偷取) |
内存资源:
| 指标 | 类型 | Prometheus 指标 |
|---|---|---|
| 利用率 | Utilization | 1 - node_memory_MemAvailable_bytes / node_memory_MemTotal_bytes |
| 饱和度 | Saturation | rate(node_vmstat_pgmajfault[5m])(主要页面错误) |
| 错误 | Errors | kube_pod_container_status_terminated_reason{reason="OOMKilled"} |
磁盘资源:
| 指标 | 类型 | Prometheus 指标 |
|---|---|---|
| 利用率 | Utilization | 1 - node_filesystem_avail_bytes / node_filesystem_size_bytes |
| 饱和度 | Saturation | rate(node_disk_io_time_seconds_total[5m]) |
| 错误 | Errors | rate(node_disk_read_errors_total[5m]) |
网络资源:
| 指标 | 类型 | Prometheus 指标 |
|---|---|---|
| 利用率 | Utilization | rate(node_network_transmit_bytes_total{device="eth0"}[5m]) |
| 饱和度 | Saturation | rate(node_netstat_Tcp_RetransSegs[5m])(TCP 重传) |
| 错误 | Errors | rate(node_network_receive_errs_total[5m]) + rate(node_network_transmit_errs_total[5m]) |
RED 方法
由 Tom Wilkie(Prometheus 早期贡献者、Grafana Labs 联合创始人)提出,专门针对请求驱动型的微服务:
RED = Rate + Errors + Duration
- Rate(速率):每秒请求数
- Errors(错误):每秒失败请求数
- Duration(持续时间):请求延迟分布
RED 方法本质上是四个黄金信号的简化版,特别适合构建微服务仪表盘——每个微服务一行,展示 Rate/Errors/Duration 三个指标。
USE vs RED vs 四个黄金信号
| 方法论 | 适用对象 | 关注维度 | 复杂度 |
|---|---|---|---|
| USE | 基础设施资源 (CPU/内存/磁盘/网络) | 利用率/饱和度/错误 | 低 |
| RED | 请求驱动型微服务 | 速率/错误/延迟 | 中 |
| 四个黄金信号 | 用户请求驱动型系统 | 延迟/流量/错误/饱和度 | 高 |
选择建议:
- 监控基础设施(节点、数据库、缓存)→ USE
- 监控微服务 API → RED
- 需要更全面的用户视角 → 四个黄金信号
SLI/SLO/SLA
定义:
- SLI (Service Level Indicator):衡量服务水平的量化指标。例如:"99% 的请求在 200ms 内完成"
- SLO (Service Level Objective):对 SLI 的目标承诺。例如:"P99 延迟 < 200ms"
- SLA (Service Level Agreement):带有商业后果的 SLO 承诺(未达标时的赔偿条款)
用 Prometheus 定义 SLO:
yaml# 告警规则:SLO 违反
groups:
  - name: slo-alerts
    rules:
      - alert: HighErrorRate
        expr: |
          100 * sum(rate(http_requests_total{status_code=~"5.."}[1h]))
              / sum(rate(http_requests_total[1h])) > 0.1
        for: 5m
        labels:
          severity: critical
        annotations:
          summary: "错误率超过 SLO (0.1%)"
错误预算 (Error Budget):
Error Budget = 1 - SLO 目标
例如 SLO 是 99.9% 可用性,则每月的 Error Budget = 0.1% × 30天 × 86400秒 ≈ 2592 秒 ≈ 43.2 分钟。
promql# 30 天错误预算消耗率
100 * (
  1 -
  sum(rate(http_requests_total{status_code!~"5.."}[30d]))
  /
  sum(rate(http_requests_total[30d]))
)
4. 安装部署
二进制安装
Step 1:下载
bash# 下载最新版(以 v2.53.0 为例)
wget https://github.com/prometheus/prometheus/releases/download/v2.53.0/prometheus-2.53.0.linux-amd64.tar.gz
tar xzf prometheus-2.53.0.linux-amd64.tar.gz
cd prometheus-2.53.0.linux-amd64
Step 2:配置 prometheus.yml
yamlglobal:
  scrape_interval: 15s       # 默认采集间隔
  evaluation_interval: 15s   # 默认规则评估间隔
  scrape_timeout: 10s        # 默认采集超时

# Prometheus 自身监控
scrape_configs:
  - job_name: 'prometheus'
    static_configs:
      - targets: ['localhost:9090']

  - job_name: 'node'
    static_configs:
      - targets:
          - '192.168.1.10:9100'
          - '192.168.1.11:9100'
        labels:
          env: 'production'

# 告警管理器
alerting:
  alertmanagers:
    - static_configs:
        - targets: ['localhost:9093']

# 告警规则文件
rule_files:
  - 'rules/*.yml'
Step 3:创建 systemd 服务
ini# /etc/systemd/system/prometheus.service
[Unit]
Description=Prometheus
After=network.target

[Service]
Type=simple
User=prometheus
Group=prometheus
ExecStart=/usr/local/bin/prometheus \
  --config.file=/etc/prometheus/prometheus.yml \
  --storage.tsdb.path=/data/prometheus \
  --storage.tsdb.retention.time=30d \
  --storage.tsdb.wal-compression \
  --web.listen-address=0.0.0.0:9090 \
  --web.enable-lifecycle \
  --web.enable-admin-api \
  --log.level=info
Restart=on-failure
LimitNOFILE=65536

[Install]
WantedBy=multi-user.targetbashsudo systemctl daemon-reload
sudo systemctl enable prometheus
sudo systemctl start prometheusStep 4:验证
bash# 检查服务状态
curl http://localhost:9090/-/healthy
# 返回 "Prometheus is Healthy."

# 检查是否抓取到自身
curl 'http://localhost:9090/api/v1/query?query=up'常用启动参数:
| 参数 | 默认值 | 说明 |
|---|---|---|
--config.file | prometheus.yml | 配置文件路径 |
--storage.tsdb.path | data/ | TSDB 数据目录 |
--storage.tsdb.retention.time | 15d | 数据保留时长 |
--storage.tsdb.retention.size | 0 (无限制) | 数据保留大小上限 |
--storage.tsdb.wal-compression | false | 启用 WAL 压缩 |
--web.listen-address | 0.0.0.0:9090 | 监听地址 |
--web.enable-lifecycle | false | 启用 API 热加载 |
--web.enable-admin-api | false | 启用管理 API |
--web.max-connections | 512 | 最大并发连接 |
--query.max-samples | 50000000 | 单次查询最大样本数 |
--query.timeout | 2m | 查询超时 |
热加载配置:
bash# 方式一:发送 SIGHUP
kill -HUP <pid>

# 方式二:HTTP API(需要 --web.enable-lifecycle)
curl -X POST http://localhost:9090/-/reload
Kubernetes 安装
方式一:直接使用 Manifests
yaml# namespace.yaml
apiVersion: v1
kind: Namespace
metadata:
name: monitoringyaml# rbac.yaml
apiVersion: v1
kind: ServiceAccount
metadata:
name: prometheus
namespace: monitoring
---
apiVersion: rbac.authorization.k8s.io/v1
kind: ClusterRole
metadata:
name: prometheus
rules:
- apiGroups: [""]
resources:
- nodes
- nodes/metrics
- nodes/proxy
- services
- endpoints
- pods
verbs: ["get", "list", "watch"]
- apiGroups: ["extensions", "networking.k8s.io"]
resources:
- ingresses
verbs: ["get", "list", "watch"]
- nonResourceURLs: ["/metrics"]
verbs: ["get"]
---
apiVersion: rbac.authorization.k8s.io/v1
kind: ClusterRoleBinding
metadata:
name: prometheus
roleRef:
apiGroup: rbac.authorization.k8s.io
kind: ClusterRole
name: prometheus
subjects:
- kind: ServiceAccount
name: prometheus
namespace: monitoringyaml# configmap.yaml - Prometheus 配置
apiVersion: v1
kind: ConfigMap
metadata:
name: prometheus-config
namespace: monitoring
data:
prometheus.yml: |
global:
scrape_interval: 15s
evaluation_interval: 15s
scrape_configs:
- job_name: 'kubernetes-apiservers'
kubernetes_sd_configs:
- role: endpoints
scheme: https
tls_config:
ca_file: /var/run/secrets/kubernetes.io/serviceaccount/ca.crt
bearer_token_file: /var/run/secrets/kubernetes.io/serviceaccount/token
relabel_configs:
- source_labels:
- __meta_kubernetes_namespace
- __meta_kubernetes_service_name
- __meta_kubernetes_endpoint_port_name
action: keep
regex: default;kubernetes;https
- job_name: 'kubernetes-nodes'
scheme: https
tls_config:
ca_file: /var/run/secrets/kubernetes.io/serviceaccount/ca.crt
bearer_token_file: /var/run/secrets/kubernetes.io/serviceaccount/token
kubernetes_sd_configs:
- role: node
relabel_configs:
- action: labelmap
regex: __meta_kubernetes_node_label_(.+)
- target_label: __address__
replacement: kubernetes.default.svc:443
- source_labels: [__meta_kubernetes_node_name]
regex: (.+)
target_label: __metrics_path__
replacement: /api/v1/nodes/${1}/proxy/metrics
- job_name: 'kubernetes-pods'
kubernetes_sd_configs:
- role: pod
relabel_configs:
- source_labels: [__meta_kubernetes_pod_annotation_prometheus_io_scrape]
action: keep
regex: true
- source_labels: [__meta_kubernetes_pod_annotation_prometheus_io_path]
action: replace
target_label: __metrics_path__
regex: (.+)
- source_labels:
- __address__
- __meta_kubernetes_pod_annotation_prometheus_io_port
action: replace
regex: ([^:]+)(?::\d+)?;(\d+)
replacement: $1:$2
target_label: __address__
- action: labelmap
regex: __meta_kubernetes_pod_label_(.+)
- source_labels: [__meta_kubernetes_namespace]
action: replace
target_label: kubernetes_namespace
- source_labels: [__meta_kubernetes_pod_name]
action: replace
target_label: kubernetes_pod_nameyaml# deployment.yaml
apiVersion: apps/v1
kind: Deployment
metadata:
name: prometheus
namespace: monitoring
spec:
replicas: 1
selector:
matchLabels:
app: prometheus
template:
metadata:
labels:
app: prometheus
spec:
serviceAccountName: prometheus
containers:
- name: prometheus
image: prom/prometheus:v2.53.0
args:
- '--config.file=/etc/prometheus/prometheus.yml'
- '--storage.tsdb.path=/prometheus'
- '--storage.tsdb.retention.time=30d'
- '--web.enable-lifecycle'
ports:
- containerPort: 9090
volumeMounts:
- name: config
mountPath: /etc/prometheus
- name: data
mountPath: /prometheus
volumes:
- name: config
configMap:
name: prometheus-config
- name: data
persistentVolumeClaim:
claimName: prometheus-data
---
apiVersion: v1
kind: PersistentVolumeClaim
metadata:
name: prometheus-data
namespace: monitoring
spec:
accessModes: ["ReadWriteOnce"]
resources:
requests:
storage: 50Gi
---
apiVersion: v1
kind: Service
metadata:
name: prometheus
namespace: monitoring
spec:
type: NodePort
ports:
- port: 9090
targetPort: 9090
nodePort: 30090
selector:
app: prometheus方式二:Helm (kube-prometheus-stack)
bash# 添加仓库
helm repo add prometheus-community https://prometheus-community.github.io/helm-charts
helm repo update

# 安装
helm install monitoring prometheus-community/kube-prometheus-stack \
  --namespace monitoring \
  --create-namespace \
  --set prometheus.prometheusSpec.retention=30d \
  --set prometheus.prometheusSpec.storageSpec.volumeClaimTemplate.spec.storageClassName=local-path \
  --set prometheus.prometheusSpec.storageSpec.volumeClaimTemplate.spec.resources.requests.storage=50Gi \
  --set grafana.adminPassword=admin123
方式三:Prometheus Operator (ServiceMonitor)
Prometheus Operator 引入了 ServiceMonitor 和 PodMonitor 两个 CRD,通过声明式方式定义监控目标:
yaml# ServiceMonitor 自动发现匹配的 Service
apiVersion: monitoring.coreos.com/v1
kind: ServiceMonitor
metadata:
  name: my-app
  namespace: monitoring
  labels:
    release: monitoring
spec:
  selector:
    matchLabels:
      app: my-app
  namespaceSelector:
    any: true
  endpoints:
    - port: http
      path: /metrics
interval: 15syaml# 对应的 Service
apiVersion: v1
kind: Service
metadata:
name: my-app
labels:
app: my-app
spec:
ports:
- name: http
port: 8080
targetPort: 8080
selector:
app: my-app5. 服务发现
静态配置 (static_configs)
最简单的服务发现,手动指定目标地址:
yamlscrape_configs:
  - job_name: 'my-app'
    static_configs:
      - targets:
          - '10.0.0.1:8080'
          - '10.0.0.2:8080'
        labels:
          env: 'production'
          team: 'backend'
文件服务发现 (file_sd_configs)
将目标列表放在外部文件中,修改文件后 Prometheus 自动重新加载:
yamlscrape_configs:
  - job_name: 'file-sd'
    file_sd_configs:
      - files:
          - '/etc/prometheus/targets/*.json'
          - '/etc/prometheus/targets/*.yaml'
        refresh_interval: 5m
JSON 格式示例:
json[
  {
    "targets": ["10.0.0.1:8080", "10.0.0.2:8080"],
    "labels": {
      "env": "production",
      "team": "backend"
    }
  }
]
Kubernetes 服务发现 (kubernetes_sd_configs)
Kubernetes SD 是云原生场景下最常用的服务发现方式,通过 K8s API 动态发现目标。
认证配置:
集群内运行时,使用 ServiceAccount 自动认证:
yamlkubernetes_sd_configs:
  - role: endpoints
    # 自动使用 /var/run/secrets/kubernetes.io/serviceaccount/ 下的凭证
集群外运行时,需要手动配置:
yamlkubernetes_sd_configs:
  - role: endpoints
    api_server: https://k8s-api.example.com:6443
    tls_config:
      ca_file: /etc/prometheus/k8s-ca.crt
    bearer_token_file: /etc/prometheus/k8s-token
五种 Role 详解:
1. endpoints role(最常用):发现 Service 对应的 Endpoints(Pod IP)
可用元标签:
__meta_kubernetes_namespace:Endpoint 所在命名空间__meta_kubernetes_service_name:对应 Service 名称__meta_kubernetes_endpoint_port_name:端口名称__meta_kubernetes_endpoint_port_protocol:端口协议__meta_kubernetes_pod_name:对应 Pod 名称__meta_kubernetes_pod_label_:Pod 标签__meta_kubernetes_pod_annotation_:Pod 注解__meta_kubernetes_pod_container_name:容器名称__meta_kubernetes_pod_node_name:Pod 所在节点
2. pod role:直接发现 Pod,不依赖 Service。适合 Pod 直接暴露指标的场景(如 DaemonSet 部署的 Exporter)。
可用元标签:
__meta_kubernetes_pod_name:Pod 名称__meta_kubernetes_namespace:命名空间__meta_kubernetes_pod_label_:Pod 标签__meta_kubernetes_pod_annotation_:Pod 注解__meta_kubernetes_pod_container_name:容器名称__meta_kubernetes_pod_container_port_name:容器端口名__meta_kubernetes_pod_container_port_number:容器端口号__meta_kubernetes_pod_node_name:所在节点__meta_kubernetes_pod_phase:Pod 阶段 (Pending/Running/Succeeded/Failed)__meta_kubernetes_pod_ready:Pod 是否 Ready (true/false)__meta_kubernetes_pod_container_init:是否为 init 容器
3. service role:发现 Service,适合监控服务本身的健康状态。
可用元标签:
__meta_kubernetes_service_name:Service 名称__meta_kubernetes_namespace:命名空间__meta_kubernetes_service_label_:Service 标签__meta_kubernetes_service_annotation_:Service 注解__meta_kubernetes_service_port_name:端口名__meta_kubernetes_service_port_protocol:端口协议__meta_kubernetes_service_cluster_ip:ClusterIP__meta_kubernetes_service_type:Service 类型 (ClusterIP/NodePort/LoadBalancer)__meta_kubernetes_service_external_name:ExternalName
4. node role:发现集群节点,适合监控节点级别指标(如 Node Exporter、kubelet)。
可用元标签:
__meta_kubernetes_node_name:节点名称__meta_kubernetes_node_label_:节点标签__meta_kubernetes_node_annotation_:节点注解__meta_kubernetes_node_address_:节点地址(InternalIP/ExternalIP/Hostname)
5. ingress role:发现 Ingress 资源,适合黑盒探测。
可用元标签:
__meta_kubernetes_ingress_name:Ingress 名称__meta_kubernetes_namespace:命名空间__meta_kubernetes_ingress_label_:Ingress 标签__meta_kubernetes_ingress_annotation_:Ingress 注解__meta_kubernetes_ingress_scheme:协议 (http/https)__meta_kubernetes_ingress_path:Ingress 路径__meta_kubernetes_ingress_host:Host
Consul 服务发现
yamlscrape_configs:
  - job_name: 'consul-services'
    consul_sd_configs:
      - server: 'consul.example.com:8500'
        token: 'my-token'
        datacenter: 'dc1'
        services: ['my-service']    # 可选,不指定则发现所有服务
        tags: ['production']         # 可选,按标签过滤
        refresh_interval: 30s
DNS 服务发现
yamlscrape_configs:
  - job_name: 'dns-sd'
    dns_sd_configs:
      - names:
          - 'my-service.default.svc.cluster.local'
        type: 'A'           # A 记录或 SRV 记录
        port: 8080          # A 记录需要指定端口
        refresh_interval: 30s
HTTP 服务发现
yamlscrape_configs:
  - job_name: 'http-sd'
    http_sd_configs:
      - url: 'http://config-server/targets'
        refresh_interval: 1m
        basic_auth:
          username: user
          password: pass
HTTP SD 端点需要返回与 file_sd 相同格式的 JSON。
Relabeling 详解
Relabeling 是 Prometheus 服务发现中最重要的机制,用于在采集前/后对标签进行修改、过滤和增强。
两个处理阶段:
- relabel_configs:在抓取前执行。作用于 Target 级别,可以决定是否采集某个目标、修改目标的地址/路径等
- metric_relabel_configs:在抓取后执行。作用于指标级别,可以过滤掉不需要的指标、修改指标的标签
所有 Action:
| Action | 说明 |
|---|---|
keep | 保留 source_labels 匹配 regex 的 Target/指标 |
drop | 丢弃 source_labels 匹配 regex 的 Target/指标 |
replace | 将 target_label 替换为 replacement(默认动作) |
labelmap | 对所有匹配 regex 的标签名执行 replacement 替换 |
labeldrop | 丢弃标签名匹配 regex 的标签 |
labelkeep | 保留标签名匹配 regex 的标签 |
hashmod | 对 source_labels 的哈希值取模,结果写入 target_label |
关键配置字段:
| 字段 | 说明 |
|---|---|
source_labels | 源标签列表,多个标签用 separator 连接 |
separator | 连接符,默认 ; |
target_label | 目标标签名(replace/hashmod 使用) |
regex | 正则表达式,默认 (.*) |
modulus | 取模数(hashmod 使用) |
replacement | 替换模板,默认 $1 |
action | 动作,默认 replace |
实战示例:
yaml# 示例1:只监控特定 namespace 的 Pod
relabel_configs:
  - source_labels: [__meta_kubernetes_namespace]
    regex: 'production|staging'
    action: keep

# 示例2:从 __address__ 提取主机和端口
relabel_configs:
  - source_labels: [__address__]
    regex: '([^:]+):(\d+)'
    target_label: __host__
  - source_labels: [__address__]
    regex: '([^:]+):(\d+)'
    replacement: '${2}'
    target_label: __port__

# 示例3:添加集群标签
relabel_configs:
  - target_label: cluster
    replacement: prod-east-1

# 示例4:使用 labelmap 将 K8s 标签映射为 Prometheus 标签
relabel_configs:
  - action: labelmap
    regex: __meta_kubernetes_node_label_(.+)
    # 将 __meta_kubernetes_node_label_topology_kubernetes_io_zone
    # 映射为 topology_kubernetes_io_zone

# 示例5:过滤不需要的指标(metric_relabel_configs)
metric_relabel_configs:
  - source_labels: [__name__]
    regex: 'go_[a-z_]+'
    action: drop    # 丢弃所有 go_ 前缀的指标
  - source_labels: [__name__]
    regex: 'container_[a-z_]+_seconds_total'
    action: drop

# 示例6:hashmod 实现分片采集
relabel_configs:
  - source_labels: [__address__]
    modulus: 4
    target_label: __tmp_hash
    action: hashmod
  - source_labels: [__tmp_hash]
    regex: '^0$'    # 只采集 hash%4==0 的目标
    action: keep

# 示例7:标签重命名
metric_relabel_configs:
  - source_labels: [kubernetes_pod_name]
    target_label: pod
    action: replace
6. 监控 K8s 节点
手动配置
最简单的方式是在 prometheus.yml 中手动写入节点 IP:
yamlscrape_configs:
  - job_name: 'node-exporter'
    static_configs:
      - targets:
          - '192.168.1.10:9100'
          - '192.168.1.11:9100'
          - '192.168.1.12:9100'
缺点:节点增减时需要手动修改配置并热加载。
自动配置:Kubernetes SD
使用 Kubernetes SD 的 node role 自动发现节点:
yamlscrape_configs:
  - job_name: 'node-exporter'
    kubernetes_sd_configs:
      - role: node
    relabel_configs:
      - action: labelmap
        regex: __meta_kubernetes_node_label_(.+)
      # 如果 Node Exporter 以 DaemonSet 方式部署在 9100 端口
      - source_labels: [__address__]
        regex: '(.*):10250'    # K8s SD 默认返回 kubelet 端口 10250
        replacement: '${1}:9100'
        target_label: __address__
Node Exporter 部署
Node Exporter 以 DaemonSet 方式部署到每个节点:
yamlapiVersion: apps/v1
kind: DaemonSet
metadata:
  name: node-exporter
  namespace: monitoring
spec:
  selector:
    matchLabels:
      app: node-exporter
  template:
    metadata:
      labels:
        app: node-exporter
    spec:
      hostPID: true          # 访问宿主机进程信息
      hostNetwork: true      # 使用宿主机网络
      hostIPC: true
      containers:
        - name: node-exporter
          image: prom/node-exporter:v1.8.0
          args:
            - '--path.procfs=/host/proc'
            - '--path.sysfs=/host/sys'
            - '--path.rootfs=/host/root'
            - '--collector.filesystem.mount-points-exclude=^/(sys|proc|dev|host|etc)($$|/)'
          ports:
            - containerPort: 9100
          volumeMounts:
            - name: proc
              mountPath: /host/proc
              readOnly: true
            - name: sys
              mountPath: /host/sys
              readOnly: true
            - name: root
              mountPath: /host/root
              readOnly: true
      volumes:
        - name: proc
          hostPath:
            path: /proc
        - name: sys
          hostPath:
            path: /sys
        - name: root
          hostPath:
            path: /
Node Exporter 关键指标
CPU 指标:
promql# CPU 使用率(按模式)
rate(node_cpu_seconds_total{mode="user"}[5m])
rate(node_cpu_seconds_total{mode="system"}[5m])
rate(node_cpu_seconds_total{mode="iowait"}[5m])

# 总 CPU 使用率
1 - avg by (instance) (rate(node_cpu_seconds_total{mode="idle"}[5m]))

# 负载
node_load1      # 1 分钟负载
node_load5      # 5 分钟负载
node_load15 # 15 分钟负载内存指标:
promql# 内存使用率
1 - node_memory_MemAvailable_bytes / node_memory_MemTotal_bytes

# 各内存区域
node_memory_Buffers_bytes       # 缓冲区
node_memory_Cached_bytes        # 页缓存
node_memory_SReclaimable_bytes  # 可回收的 slab
# MemAvailable = MemFree + Buffers + Cached + SReclaimable

# Swap 使用
1 - node_memory_SwapFree_bytes / node_memory_SwapTotal_bytes磁盘指标:
promql# 磁盘使用率
1 - node_filesystem_avail_bytes{fstype!~"tmpfs|overlay"}
    / node_filesystem_size_bytes{fstype!~"tmpfs|overlay"}

# inode 使用率
1 - node_filesystem_files_free{fstype!~"tmpfs|overlay"}
    / node_filesystem_files{fstype!~"tmpfs|overlay"}

# 磁盘 IO
rate(node_disk_read_bytes_total[5m])     # 读速率
rate(node_disk_written_bytes_total[5m])  # 写速率
rate(node_disk_io_time_seconds_total[5m]) # IO 时间占比网络指标:
promql# 网络流量
rate(node_network_receive_bytes_total{device=~"eth.*"}[5m])
rate(node_network_transmit_bytes_total{device=~"eth.*"}[5m])

# 网络错误
rate(node_network_receive_errs_total{device=~"eth.*"}[5m])
rate(node_network_transmit_errs_total{device=~"eth.*"}[5m])

# 网络丢包
rate(node_network_receive_drop_total{device=~"eth.*"}[5m])
rate(node_network_transmit_drop_total{device=~"eth.*"}[5m])
7. K8s 监控项分类深入
UCloud K8s 控制平面组件监控
在 UCloud 托管 K8s 集群中,控制平面组件(kube-controller-manager、kube-scheduler、kubelet)运行在 Master 节点上,默认端口与自建集群一致。以下是针对 UCloud K8s 集群的 Prometheus 采集配置:
yamlscrape_configs:
# Controller Manager 监控配置
- job_name: 'kube-controller-manager'
  scheme: https
  tls_config:
    ca_file: /var/run/secrets/kubernetes.io/serviceaccount/ca.crt
    insecure_skip_verify: true
  bearer_token_file: /var/run/secrets/kubernetes.io/serviceaccount/token
  kubernetes_sd_configs:
  - role: node
  relabel_configs:
  # 匹配 master 节点
  - source_labels: [__meta_kubernetes_node_label_node_role_kubernetes_io_master]
    action: keep
    regex: ''
  # 修改端口
  - source_labels: [__address__]
    regex: '(.*):10250'
    replacement: '${1}:10257'
    target_label: __address__
  - target_label: component
    replacement: kube-controller-manager

# Scheduler 监控配置
- job_name: 'kube-scheduler'
  scheme: https
  tls_config:
    ca_file: /var/run/secrets/kubernetes.io/serviceaccount/ca.crt
    insecure_skip_verify: true
  bearer_token_file: /var/run/secrets/kubernetes.io/serviceaccount/token
  kubernetes_sd_configs:
  - role: node
  relabel_configs:
  - source_labels: [__meta_kubernetes_node_label_node_role_kubernetes_io_master]
    action: keep
    regex: ''
  - source_labels: [__address__]
    regex: '(.*):10250'
    replacement: '${1}:10259'  # scheduler 的端口是 10259
    target_label: __address__
  - target_label: component
    replacement: kube-scheduler

# Kubelet 监控配置(包含 cAdvisor)
- job_name: 'kubelet'
  scheme: https
  tls_config:
    ca_file: /var/run/secrets/kubernetes.io/serviceaccount/ca.crt
    insecure_skip_verify: true
  bearer_token_file: /var/run/secrets/kubernetes.io/serviceaccount/token
  kubernetes_sd_configs:
  - role: node
  relabel_configs:
  - target_label: component
    replacement: kubelet

  # 可选:添加指标路径(默认是 /metrics)
  metrics_path: /metrics
  # cAdvisor 指标路径是 /metrics/cadvisor
  # 如果需要单独监控 cAdvisor,可以再配置一个 job

# 单独监控 cAdvisor
- job_name: 'kubelet-cadvisor'
  scheme: https
  tls_config:
    ca_file: /var/run/secrets/kubernetes.io/serviceaccount/ca.crt
    insecure_skip_verify: true
  bearer_token_file: /var/run/secrets/kubernetes.io/serviceaccount/token
  kubernetes_sd_configs:
  - role: node
  metrics_path: /metrics/cadvisor
  relabel_configs:
  - target_label: component
replacement: kubelet-cadvisor配置要点:
- 认证方式:使用 ServiceAccount 的
ca.crt和token进行 TLS + Bearer Token 认证,insecure_skip_verify: true跳过证书验证(因为组件使用自签证书) - Controller Manager:默认监听
10257端口(HTTPS),通过 relabel 将 K8s SD 返回的 kubelet 端口10250替换为10257,同时仅保留node_role_kubernetes_io_master标签存在的节点 - Scheduler:默认监听
10259端口(HTTPS),同样通过 relabel 替换端口,仅匹配 Master 节点 - Kubelet:默认监听
10250端口(HTTPS),/metrics提供 kubelet 自身指标,/metrics/cadvisor提供容器级资源指标 - cAdvisor:内嵌在 kubelet 中,建议单独配置 job 采集
/metrics/cadvisor,便于独立管理和过滤
Pod/容器监控
cAdvisor 指标(内嵌在 kubelet,无需单独部署):
cAdvisor 提供容器级别的资源使用指标:
promql# 容器 CPU 使用率
sum(rate(container_cpu_usage_seconds_total{container!=""}[5m])) by (pod, namespace)
/
sum(container_resource_limits_cpu_cores{container!=""}) by (pod, namespace) * 100

# 容器内存使用(working set,即 OOM 的判断依据)
container_memory_working_set_bytes{container!=""}

# 容器内存使用率
container_memory_working_set_bytes{container!=""}
/
container_resource_limits_memory_bytes{container!=""} * 100

# 容器网络流量
rate(container_network_receive_bytes_total{container!=""}[5m])
rate(container_network_transmit_bytes_total{container!=""}[5m])

# 容器磁盘 IO
rate(container_fs_reads_bytes_total{container!=""}[5m])
rate(container_fs_writes_bytes_total{container!=""}[5m])kube-state-metrics:
kube-state-metrics 通过监听 K8s API,暴露集群状态指标:
promql# Pod 状态
kube_pod_status_phase{phase="Running"} == 1
kube_pod_status_phase{phase="Failed"} == 1
kube_pod_status_phase{phase="Pending"} == 1

# 容器重启次数
kube_pod_container_status_restarts_total

# 容器状态
kube_pod_container_status_waiting_reason{reason="CrashLoopBackOff"} == 1
kube_pod_container_status_terminated_reason{reason="OOMKilled"} == 1

# Deployment 副本数
kube_deployment_status_replicas_ready
kube_deployment_status_replicas_unavailable

# 副本集状态
kube_replicaset_status_ready_replicas
kube_replicaset_status_replicas
OOMKill 检测:
yaml# 告警规则
groups:
  - name: pod-alerts
    rules:
      - alert: PodOOMKilled
        expr: kube_pod_container_status_terminated_reason{reason="OOMKilled"} == 1
        for: 1m
        labels:
          severity: critical
        annotations:
          summary: "Pod {{ $labels.namespace }}/{{ $labels.pod }} 被 OOMKill"
          description: "容器 {{ $labels.container }} 因内存超限被终止"

      - alert: PodCrashLoopBackOff
        expr: kube_pod_container_status_waiting_reason{reason="CrashLoopBackOff"} == 1
        for: 5m
        labels:
          severity: warning
        annotations:
summary: "Pod {{ $labels.namespace }}/{{ $labels.pod }} CrashLoopBackOff"资源限制监控:
promql# Pod 资源请求/限制
kube_pod_container_resource_requests_cpu_cores
kube_pod_container_resource_limits_cpu_cores
kube_pod_container_resource_requests_memory_bytes
kube_pod_container_resource_limits_memory_bytes

# 集群资源分配率(已分配/总容量)
sum(kube_pod_container_resource_requests_cpu_cores) by (node)
/
sum(kube_node_status_allocatable{resource="cpu"}) by (node) * 100

# CPU Limit 使用率
sum(rate(container_cpu_usage_seconds_total{container!=""}[5m])) by (pod, namespace)
/
sum(kube_pod_container_resource_limits_cpu_cores) by (pod, namespace) * 100
PV/PVC 监控
kube-state-metrics PV/PVC 指标:
promql# PVC 状态
kube_persistentvolumeclaim_status_phase{phase="Bound"} == 1
kube_persistentvolumeclaim_status_phase{phase="Lost"} == 1
kube_persistentvolumeclaim_status_phase{phase="Pending"} == 1

# PVC 请求容量
kube_persistentvolumeclaim_resource_requests_storage_bytes

# PV 容量
kube_persistentvolume_capacity_bytes

# PV 状态
kube_persistentvolume_status_phase{phase="Available"} == 1
kube_persistentvolume_status_phase{phase="Released"} == 1
kubelet volume stats(kubelet 直接暴露,无需额外部署):
promql# 卷容量和使用量
kubelet_volume_stats_capacity_bytes
kubelet_volume_stats_used_bytes
kubelet_volume_stats_available_bytes

# 卷使用率
kubelet_volume_stats_used_bytes / kubelet_volume_stats_capacity_bytes * 100

# inode 使用
kubelet_volume_stats_inodes_used
kubelet_volume_stats_inodes_total
kubelet_volume_stats_inodes_used / kubelet_volume_stats_inodes_total * 100
PV/PVC 告警规则:
yamlgroups:
  - name: storage-alerts
    rules:
      - alert: PVAlmostFull
        expr: kubelet_volume_stats_used_bytes / kubelet_volume_stats_capacity_bytes > 0.85
        for: 5m
        labels:
          severity: warning
        annotations:
          summary: "PVC {{ $labels.namespace }}/{{ $labels.persistentvolumeclaim }} 使用率超过 85%"

      - alert: PVCFull
        expr: kubelet_volume_stats_used_bytes / kubelet_volume_stats_capacity_bytes > 0.95
        for: 1m
        labels:
          severity: critical
        annotations:
          summary: "PVC {{ $labels.namespace }}/{{ $labels.persistentvolumeclaim }} 使用率超过 95%"
网络监控
CoreDNS 监控:
CoreDNS 是 K8s 集群的 DNS 服务,其指标对排查 DNS 问题至关重要:
promql# DNS 请求速率
sum(rate(coredns_dns_request_count_total[5m])) by (type)

# DNS 请求延迟
histogram_quantile(0.99, rate(coredns_dns_request_duration_seconds_bucket[5m]))

# DNS 错误率
sum(rate(coredns_dns_response_rcode_count_total{rcode="SERVFAIL"}[5m]))
/
sum(rate(coredns_dns_request_count_total[5m]))

# 缓存命中/未命中
rate(coredns_cache_hits_total[5m])
rate(coredns_cache_misses_total[5m])
CNI 网络指标:
不同 CNI 提供不同指标,以 Calico 为例:
promql# Calico BGP 会话状态
calico_bgp_session_state

# Calico 路由数
calico_bgp_num_routes

# Cilium 端点状态
cilium_endpoint_state

# Cilium 连接跟踪表使用
cilium_ct_entries_total
Service/Endpoint 连通性:
promql# Endpoint 就绪数
kube_endpoint_address_available
kube_endpoint_address_not_ready

# Service 是否有可用 Endpoint
kube_endpoint_address_available == 0
8. 黑盒监控与白盒监控
黑盒监控:Blackbox Exporter
定义:黑盒监控从外部探测系统的可用性和性能,不关心内部实现,只关注"从用户视角看系统是否正常"。
Blackbox Exporter 充当探测代理,Prometheus 告诉它"去探测某个目标",它返回探测结果。
安装:
bash# 二进制安装
wget https://github.com/prometheus/blackbox_exporter/releases/download/v0.25.0/blackbox_exporter-0.25.0.linux-amd64.tar.gz
tar xzf blackbox_exporter-0.25.0.linux-amd64.tar.gz
配置文件 (blackbox.yml):
yamlmodules:
  http_2xx:
    prober: http
    timeout: 5s
    http:
      valid_status_codes: [200]
      method: GET
      headers:
        Accept: application/json
      preferred_ip_protocol: ip4
      follow_redirects: true

  http_post_2xx:
    prober: http
    timeout: 5s
    http:
      method: POST
      headers:
        Content-Type: application/json
      body: '{"key":"value"}'

  tcp_connect:
    prober: tcp
    timeout: 5s

  icmp:
    prober: icmp
    timeout: 3s
    icmp:
      preferred_ip_protocol: ip4

  dns:
    prober: dns
    timeout: 5s
    dns:
      query_name: "example.com"
      query_type: "A"
      valid_rcodes:
        - NOERROR
Prometheus 中的配置:
yamlscrape_configs:
  # HTTP 探测
  - job_name: 'blackbox-http'
    metrics_path: /probe
    params:
      module: [http_2xx]
    static_configs:
      - targets:
          - https://www.example.com
          - https://api.example.com/health
    relabel_configs:
      - source_labels: [__address__]
        target_label: __param_target
      - source_labels: [__param_target]
        target_label: instance
      - target_label: __address__
        replacement: blackbox-exporter:9115

  # ICMP 探测
  - job_name: 'blackbox-icmp'
    metrics_path: /probe
    params:
      module: [icmp]
    static_configs:
      - targets:
          - 192.168.1.1
          - 192.168.1.2
    relabel_configs:
      - source_labels: [__address__]
        target_label: __param_target
      - source_labels: [__param_target]
        target_label: instance
      - target_label: __address__
        replacement: blackbox-exporter:9115

  # DNS 探测
  - job_name: 'blackbox-dns'
    metrics_path: /probe
    params:
      module: [dns]
    static_configs:
      - targets:
          - 8.8.8.8
    relabel_configs:
      - source_labels: [__address__]
        target_label: __param_target
      - source_labels: [__param_target]
        target_label: instance
      - target_label: __address__
        replacement: blackbox-exporter:9115

  # TCP 端口探测
  - job_name: 'blackbox-tcp'
    metrics_path: /probe
    params:
      module: [tcp_connect]
    static_configs:
      - targets:
          - mysql.example.com:3306
          - redis.example.com:6379
    relabel_configs:
      - source_labels: [__address__]
        target_label: __param_target
      - source_labels: [__param_target]
        target_label: instance
      - target_label: __address__
replacement: blackbox-exporter:9115关键指标:
promql# 探测是否成功
probe_success

# 探测耗时
probe_duration_seconds

# HTTP 状态码
probe_http_status_code

# SSL 证书过期时间
probe_ssl_earliest_cert_expiry

# SSL 证书剩余天数
(probe_ssl_earliest_cert_expiry - time()) / 86400

# DNS 解析耗时
probe_dns_lookup_time_seconds

# HTTP 各阶段耗时
probe_http_duration_seconds{phase="connect"}      # TCP 连接
probe_http_duration_seconds{phase="tls"}          # TLS 握手
probe_http_duration_seconds{phase="processing"}   # 服务器处理
probe_http_duration_seconds{phase="resolve"}      # DNS 解析
probe_http_duration_seconds{phase="transfer"}     # 数据传输
SSL 证书过期告警:
yamlgroups:
  - name: blackbox-alerts
    rules:
      - alert: SSLCertExpiringSoon
        expr: (probe_ssl_earliest_cert_expiry - time()) / 86400 < 30
        for: 1h
        labels:
          severity: warning
        annotations:
          summary: "SSL 证书将在 {{ $value | printf \"%.0f\" }} 天后过期"
          description: "目标 {{ $labels.instance }} 的 SSL 证书即将过期"

      - alert: ProbeFailed
        expr: probe_success == 0
        for: 5m
        labels:
          severity: critical
        annotations:
          summary: "探测失败: {{ $labels.instance }}"
白盒监控
定义:白盒监控通过应用内部埋点获取指标,能看到系统内部的运行状态。
Go 客户端库示例:
gopackage main

import (
    "net/http"
    "github.com/prometheus/client_golang/prometheus"
    "github.com/prometheus/client_golang/prometheus/promhttp"
)

var (
    httpRequestsTotal = prometheus.NewCounterVec(
        prometheus.CounterOpts{
            Name: "http_requests_total",
            Help: "Total number of HTTP requests",
        },
        []string{"method", "handler", "status_code"},
    )

    httpRequestDuration = prometheus.NewHistogramVec(
        prometheus.HistogramOpts{
            Name:    "http_request_duration_seconds",
            Help:    "HTTP request duration in seconds",
            Buckets: prometheus.DefBuckets,
        },
        []string{"method", "handler"},
    )

    activeConnections = prometheus.NewGauge(
        prometheus.GaugeOpts{
            Name: "active_connections",
            Help: "Number of active connections",
        },
    )
)

func init() {
    prometheus.MustRegister(httpRequestsTotal)
    prometheus.MustRegister(httpRequestDuration)
    prometheus.MustRegister(activeConnections)
}

func main() {
    http.Handle("/metrics", promhttp.Handler())
    http.ListenAndServe(":8080", nil)
}
Python 客户端库示例:
pythonfrom prometheus_client import Counter, Histogram, generate_latest
from flask import Flask, Response

app = Flask(__name__)

REQUEST_COUNT = Counter(
    'http_requests_total',
    'Total HTTP requests',
    ['method', 'endpoint', 'status']
)

REQUEST_LATENCY = Histogram(
    'http_request_duration_seconds',
    'HTTP request latency',
    ['method', 'endpoint']
)

@app.route('/metrics')
def metrics():
    return Response(generate_latest(), mimetype='text/plain')

@app.route('/api/users')
@REQUEST_LATENCY.labels('GET', '/api/users').time()
def get_users():
    REQUEST_COUNT.labels('GET', '/api/users', 200).inc()
    return {'users': []}
黑盒 vs 白盒对比
| 维度 | 黑盒监控 | 白盒监控 |
|---|---|---|
| 视角 | 外部用户 | 内部开发者 |
| 知道什么 | 系统是否可用 | 系统为什么可用/不可用 |
| 实现 | 探测 (probe) | 埋点 (instrument) |
| 依赖 | 不依赖应用代码 | 需要应用配合 |
| 典型场景 | 可用性检测、SSL 过期、端口连通 | 性能分析、容量规划、根因定位 |
| 工具 | Blackbox Exporter | 客户端库/Exporter |
最佳实践:两者结合:
- 白盒监控回答"系统内部怎么了"——CPU 高、内存不足、请求队列堆积
- 黑盒监控回答"用户能不能用"——页面能不能打开、API 能不能调通
- 先用黑盒发现问题,再用白盒定位原因
9. 指标类型
Counter(计数器)
定义:Counter 是一个单调递增的指标,只能增加或在重启时归零。适用于累计计数场景,如请求总数、错误总数、已完成任务数。
命名约定:Counter 指标名应以 _total 为后缀,如 http_requests_total。
核心特性:
- 单调递增:值只会变大(除非进程重启归零)
- 不能减少:不要用 Counter 表示可减的值(如当前连接数),那是 Gauge
- 必须配合 rate/irate/increase 使用才有意义
关联函数:
promql# rate:计算每秒平均增长率(推荐,适合告警和仪表盘)
rate(http_requests_total[5m])

# irate:计算最后两个数据点的瞬时增长率(更灵敏,适合图表展示瞬时变化)
irate(http_requests_total[5m])

# increase:计算时间窗口内的总增量(等价于 rate × 时间窗口秒数)
increase(http_requests_total[1h])
rate vs irate vs increase:
| 函数 | 计算方式 | 灵敏度 | 适用场景 |
|---|---|---|---|
| rate | 窗口内所有点的线性回归 | 平滑 | 告警、仪表盘 |
| irate | 仅用最后两个点 | 高灵敏度 | 瞬时变化图 |
| increase | rate × 窗口秒数 | 同 rate | 需要增量值 |
Go 客户端示例:
govar requestCount = prometheus.NewCounterVec(
    prometheus.CounterOpts{
        Name: "http_requests_total",
        Help: "Total number of HTTP requests",
    },
    []string{"method", "handler", "code"},
)

// 在请求处理中递增
requestCount.WithLabelValues("GET", "/api/users", "200").Inc()
Python 客户端示例:
pythonfrom prometheus_client import Counter

request_count = Counter(
    'http_requests_total',
    'Total HTTP requests',
    ['method', 'handler', 'code']
)

# 递增
request_count.labels('GET', '/api/users', '200').inc()
Gauge(仪表盘)
定义:Gauge 是可以任意增减的指标,表示某一时刻的状态值。适用于当前温度、内存使用量、队列长度等场景。
核心特性:
- 可增可减
- 表示瞬时值
- 直接使用,不需要 rate
关联函数:
promql# deriv:计算时间序列的导数(变化率)
deriv(node_memory_MemAvailable_bytes[1h])

# predict_linear:基于线性回归预测未来值
predict_linear(node_filesystem_avail_bytes[1h], 3600)  # 预测 1 小时后的值
Go 客户端示例:
govar activeConnections = prometheus.NewGaugeVec(
    prometheus.GaugeOpts{
        Name: "active_connections",
        Help: "Number of active connections",
    },
    []string{"service"},
)

// 设置值
activeConnections.WithLabelValues("api").Set(42)
// 递增/递减
activeConnections.WithLabelValues("api").Inc()
activeConnections.WithLabelValues("api").Dec()
Histogram(直方图)
定义:Histogram 将观测值放入预定义的桶(bucket)中进行计数,同时记录总和和观测次数。
暴露的时间序列(以 http_request_duration_seconds 为基础名):
<basename>_bucket{le="<上界>"}:累积计数器,表示 ≤ 上界的观测次数<basename>_sum:所有观测值之和<basename>_count:观测次数(等同于_bucket{le="+Inf"})
累积直方图概念:
Prometheus 的 Histogram 是累积的(cumulative),即每个桶的计数包含所有更小的桶。例如:
texthttp_request_duration_seconds_bucket{le="0.1"}  10    # ≤ 0.1s 的有 10 个
http_request_duration_seconds_bucket{le="0.5"}  45    # ≤ 0.5s 的有 45 个(包含 ≤ 0.1s 的 10 个)
http_request_duration_seconds_bucket{le="1.0"}  89    # ≤ 1.0s 的有 89 个
http_request_duration_seconds_bucket{le="+Inf"} 100   # 所有 100 个请求
histogram_quantile() 函数:
从 Histogram 数据计算分位数(P50/P90/P95/P99):
promql# P99 延迟
histogram_quantile(0.99, rate(http_request_duration_seconds_bucket[5m]))

# 按 handler 分组的 P99
histogram_quantile(0.99,
  sum by (le, handler) (rate(http_request_duration_seconds_bucket[5m]))
)默认桶:
goprometheus.DefBuckets = []float64{.005, .01, .025, .05, .1, .25, .5, 1, 2.5, 5, 10}自定义桶:
govar requestDuration = prometheus.NewHistogramVec(
    prometheus.HistogramOpts{
        Name:    "http_request_duration_seconds",
        Help:    "HTTP request duration",
        Buckets: []float64{0.01, 0.05, 0.1, 0.25, 0.5, 1, 2.5, 5, 10, 30},
    },
    []string{"handler"},
)
Native Histogram(原生直方图):
从 Prometheus v2.40 开始实验性支持。原生 Histogram 只需要一个时间序列即可存储完整的分布数据(通过稀疏桶),大幅降低存储成本,同时支持更高精度的分位数计算。
Summary(摘要)
定义:Summary 在客户端侧计算分位数,直接暴露 φ-分位数的值。
暴露的时间序列:
<basename>{quantile="<φ>"}:φ-分位数值(如 0.5, 0.9, 0.99)<basename>_sum:所有观测值之和<basename>_count:观测次数
Go 客户端示例:
govar requestDuration = prometheus.NewSummaryVec(
    prometheus.SummaryOpts{
        Name:       "http_request_duration_seconds",
        Help:       "HTTP request duration",
        Objectives: map[float64]float64{0.5: 0.05, 0.9: 0.01, 0.99: 0.001},
        MaxAge:     10 * time.Minute,   // 滑动窗口
    },
    []string{"handler"},
)
Histogram vs Summary 对比
| 维度 | Histogram | Summary |
|---|---|---|
| 分位数计算位置 | 服务端 (PromQL) | 客户端 |
| 可聚合性 | ✅ 可对多个实例聚合 | ❌ 不可聚合 |
| 分位数精度 | 近似值(取决于桶边界) | 可配置精度 |
| 配置 | 桶边界 | 分位数目标 + 误差容忍度 |
| 存储开销 | 桶数 × 标签组合 | 分位数个数 × 标签组合 |
| 典型场景 | 延迟分布、可聚合的分位数 | 单实例精确分位数 |
选择建议:
- 需要聚合多个实例的分位数 → Histogram(绝大多数场景)
- 只需单个实例的精确分位数 → Summary
10. PromQL
数据类型
PromQL 有四种数据类型:
- Instant Vector(瞬时向量):一组时间序列,每个序列只有一个最新值
promqlup{job="prometheus"} - Range Vector(范围向量):一组时间序列,每个序列有一段时间内的值
范围向量不能直接用于图表展示,必须配合 rate/increase 等函数转换为瞬时向量。promqlup{job="prometheus"}[5m] - Scalar(标量):一个简单的数字值
promql100 3.14 - String(字符串):字符串值(目前很少使用)
选择器
指标名称选择:
promqlhttp_requests_total标签匹配器:
| 匹配器 | 含义 | 示例 |
|---|---|---|
= | 精确匹配 | method="GET" |
!= | 不等于 | method!="POST" |
=~ | 正则匹配 | uri=~"/api/.*" |
!~ | 正则不匹配 | uri!~"/healthz" |
promql# 精确匹配
http_requests_total{method="GET", status_code="200"}

# 正则匹配:匹配 2xx 和 3xx 状态码
http_requests_total{status_code=~"2..|3.."}

# 排除特定路径
http_requests_total{uri!~"/health|/metrics"}
范围选择器
promql# 最近 5 分钟
http_requests_total[5m]

# 最近 1 小时
http_requests_total[1h]

# offset:查看历史时间窗口
http_requests_total[5m] offset 1h    # 1 小时前的 5 分钟

# @:指定绝对时间(Unix 时间戳)
http_requests_total @ 1700000000时间单位:s(秒)、m(分)、h(时)、d(天)、w(周)、y(年)。
运算符
算术运算符:+, -, *, /, %, ^
promql# 字节转 MB
node_memory_MemTotal_bytes / 1024 / 1024

# 使用率百分比
(1 - node_memory_MemAvailable_bytes / node_memory_MemTotal_bytes) * 100比较运算符:==, !=, >, <, >=, <=
promql# 普通比较:返回满足条件的值
up == 0

# bool 修饰:返回 0 或 1 而不是过滤
up == bool 1 # 所有 up 指标返回 1逻辑运算符:and, or, unless
promql# and:两个向量都有的标签组合
metric1 and metric2

# or:任一向量有的标签组合
metric1 or metric2

# unless:左向量有但右向量没有的
metric1 unless metric2向量匹配:
当两个瞬时向量进行运算时,需要定义如何匹配标签:
promql# on:只按指定标签匹配
sum(rate(http_requests_total[5m])) by (handler)
  / on (handler)
sum(rate(http_requests_total[5m])) by (handler) * 100

# ignoring:忽略指定标签后匹配
metric1 / ignoring (version) metric2

# group_left:多对一匹配(左边的多个元素匹配右边的一个)
kube_pod_container_resource_limits_cpu_cores
  * on (pod, namespace) group_left
kube_pod_status_phase{phase="Running"}

# group_right:一对多匹配(右边的多个元素匹配左边的一个)
聚合运算符
promql# by:按指定标签分组
sum by (handler) (rate(http_requests_total[5m]))

# without:排除指定标签后分组
sum without (instance) (rate(http_requests_total[5m]))| 运算符 | 说明 | 示例 |
|---|---|---|
sum | 求和 | sum by (job) (up) |
avg | 平均值 | avg by (node) (cpu_usage) |
count | 计数 | count by (job) (up) |
min | 最小值 | min by (instance) (latency) |
max | 最大值 | max by (instance) (latency) |
stddev | 标准差 | stddev by (job) (latency) |
stdvar | 方差 | stdvar by (job) (latency) |
topk | 取前 K 个 | topk(3, sum by (job) (rate(http_requests_total[5m]))) |
bottomk | 取后 K 个 | bottomk(3, ...) |
quantile | 计算分位数 | quantile(0.95, latency) |
count_values | 按值计数 | count_values by (status) ("status", http_status) |
函数大全
速率计算:
promql# rate:计算范围向量的每秒平均增长率
rate(http_requests_total[5m])

# irate:仅用最后两个数据点计算瞬时增长率
irate(http_requests_total[5m])

# increase:计算时间窗口内的总增量
increase(http_requests_total[1h])趋势预测:
promql# deriv:计算简单线性回归的导数
deriv(gauge_metric[1h])

# predict_linear:基于线性回归预测未来值
predict_linear(node_filesystem_avail_bytes[1h], 3600) # 预测 1 小时后的可用空间分位数:
promql# histogram_quantile:从 Histogram 桶计算分位数
histogram_quantile(0.99, rate(http_request_duration_seconds_bucket[5m]))缺失检测:
promql# absent:如果向量无数据则返回 1,否则无输出
absent(up{job="my-job"})    # 当 my-job 完全无数据时返回 1

# absent_over_time:时间窗口内无数据则返回 1
absent_over_time(up{job="my-job"}[1h])变化检测:
promql# changes:范围向量内值变化的次数
changes(up[1h])

# resets:范围向量内值重置(归零)的次数
resets(counter_metric[1h])标签操作:
promql# label_replace:正则替换标签值
label_replace(up, "host", "$1", "instance", "(.*):.*")
# 从 instance="10.0.0.1:9090" 提取 host="10.0.0.1"

# label_join:连接多个标签值
label_join(up, "new_label", "-", "label1", "label2")
# new_label = label1 + "-" + label2时间函数:
promql# time:当前 Unix 时间戳
time()

# vector:将标量转为向量
vector(1)

# scalar:将单元素向量转为标量
scalar(up{job="prometheus"})数学函数:
promqlceil(1.5)           # 2,向上取整
floor(1.5)          # 1,向下取整
round(1.5)          # 2,四舍五入
round(1.5, 0.1)     # 1.5,按 0.1 精度四舍五入
clamp(x, min, max)  # 限制在 [min, max] 范围
clamp_max(x, max)   # 限制最大值
clamp_min(x, min)   # 限制最小值
abs(x)              # 绝对值
log(x)              # 自然对数
log2(x)             # 以 2 为底的对数
log10(x)            # 以 10 为底的对数
sqrt(x) # 平方根时间窗口聚合(对范围向量中的每个样本进行聚合):
promqlavg_over_time(metric[5m])       # 5 分钟平均值
sum_over_time(metric[5m])       # 5 分钟总和
min_over_time(metric[5m])       # 5 分钟最小值
max_over_time(metric[5m])       # 5 分钟最大值
count_over_time(metric[5m])     # 5 分钟样本数
quantile_over_time(0.95, metric[5m])  # 5 分钟 95 分位数
stddev_over_time(metric[5m])    # 5 分钟标准差
stdvar_over_time(metric[5m])    # 5 分钟方差
实战查询示例
1. 节点 CPU 使用率:
promql100 - (avg by (instance) (rate(node_cpu_seconds_total{mode="idle"}[5m])) * 100)2. 节点内存使用率:
promql(1 - node_memory_MemAvailable_bytes / node_memory_MemTotal_bytes) * 1003. 磁盘使用率:
promql(1 - node_filesystem_avail_bytes{fstype!~"tmpfs|overlay"}
    / node_filesystem_size_bytes{fstype!~"tmpfs|overlay"}) * 100
4. 网络带宽:
promql# 接收带宽
rate(node_network_receive_bytes_total{device=~"eth.*"}[5m]) * 8 / 1000000000  # Gbps

# 发送带宽
rate(node_network_transmit_bytes_total{device=~"eth.*"}[5m]) * 8 / 1000000000
5. HTTP QPS:
promqlsum by (handler) (rate(http_requests_total[5m]))6. 错误率:
promql100 * sum(rate(http_requests_total{status_code=~"5.."}[5m]))
    / sum(rate(http_requests_total[5m]))
7. P99 延迟:
promqlhistogram_quantile(0.99,
  sum by (le, handler) (rate(http_request_duration_seconds_bucket[5m]))
)
8. 容器重启次数:
promqlsum by (namespace, pod) (increase(kube_pod_container_status_restarts_total[1h]))9. Pod 不可用检测:
promqlkube_pod_status_phase{phase!="Running"} == 110. PV 容量告警:
promql(kubelet_volume_stats_used_bytes / kubelet_volume_stats_capacity_bytes) * 100 > 8511. SSL 证书剩余天数:
promql(probe_ssl_earliest_cert_expiry - time()) / 8640012. 预测磁盘满的时间:
promql# 磁盘多久后会满(小时)
node_filesystem_avail_bytes{fstype!~"tmpfs|overlay"}
  /
  deriv(node_filesystem_avail_bytes{fstype!~"tmpfs|overlay"}[1h])
  / 3600
13. 多集群聚合:
promql# 按集群汇总 CPU 使用率
sum by (cluster) (
  1 - avg by (instance, cluster) (rate(node_cpu_seconds_total{mode="idle"}[5m]))
)
14. 容量规划 — 集群资源分配率:
promql# CPU 已分配/可分配
sum(kube_pod_container_resource_requests_cpu_cores) by (node)
  / sum(kube_node_status_allocatable{resource="cpu"}) by (node) * 100

# 内存已分配/可分配
sum(kube_pod_container_resource_requests_memory_bytes) by (node)
  / sum(kube_node_status_allocatable{resource="memory"}) by (node) * 100
15. K8s Deployment 可用副本不足:
promqlkube_deployment_status_replicas_unavailable > 0Recording Rules
Recording Rules 用于预计算耗时的 PromQL 查询,将结果保存为新的时间序列,减少实时查询的计算压力。
配置:
yaml# rules/recording.yml
groups:
  - name: node_rules
    interval: 30s
    rules:
      - record: node:cpu_usage:ratio
        expr: 1 - avg by (instance) (rate(node_cpu_seconds_total{mode="idle"}[5m]))
        labels:
          severity: info

      - record: node:memory_usage:ratio
        expr: 1 - node_memory_MemAvailable_bytes / node_memory_MemTotal_bytes

      - record: node:disk_usage:ratio
        expr: 1 - node_filesystem_avail_bytes{fstype!~"tmpfs|overlay"}
                / node_filesystem_size_bytes{fstype!~"tmpfs|overlay"}

      - record: job:http_requests:rate5m
        expr: sum by (job, handler, status_code) (rate(http_requests_total[5m]))

      - record: job:http_error_rate:ratio
        expr: |
          sum by (job) (rate(http_requests_total{status_code=~"5.."}[5m]))
          /
sum by (job) (rate(http_requests_total[5m]))命名约定:
textlevel:metric:operations

示例:
- node:cpu_usage:ratio               # 节点级 CPU 使用率
- cluster:cpu_requests:ratio         # 集群级 CPU 分配率
- job:http_requests:rate5m           # Job 级 HTTP 请求速率
- job:http_error_rate:ratio # Job 级 HTTP 错误率优化策略:
- 将耗时聚合查询转为 Recording Rule
- 在 Recording Rule 基础上再构建告警规则,避免重复计算
- 对高频仪表盘查询使用 Recording Rule 预计算
- 合理设置
interval(通常 30s-1m)